
Work/Fund systems

Meridian Digital Fund

Meridian Digital Fund is a fictional fund, and this is the back office that keeps its books. The software behind it is in production at a real operating hedge fund. Every figure in the demo is sample data.

DemoWeb

Meridian Digital Fund, managed by Meridian Capital, is fictional for this demo and not connected to any real firm with a similar name. Every figure is sample data.

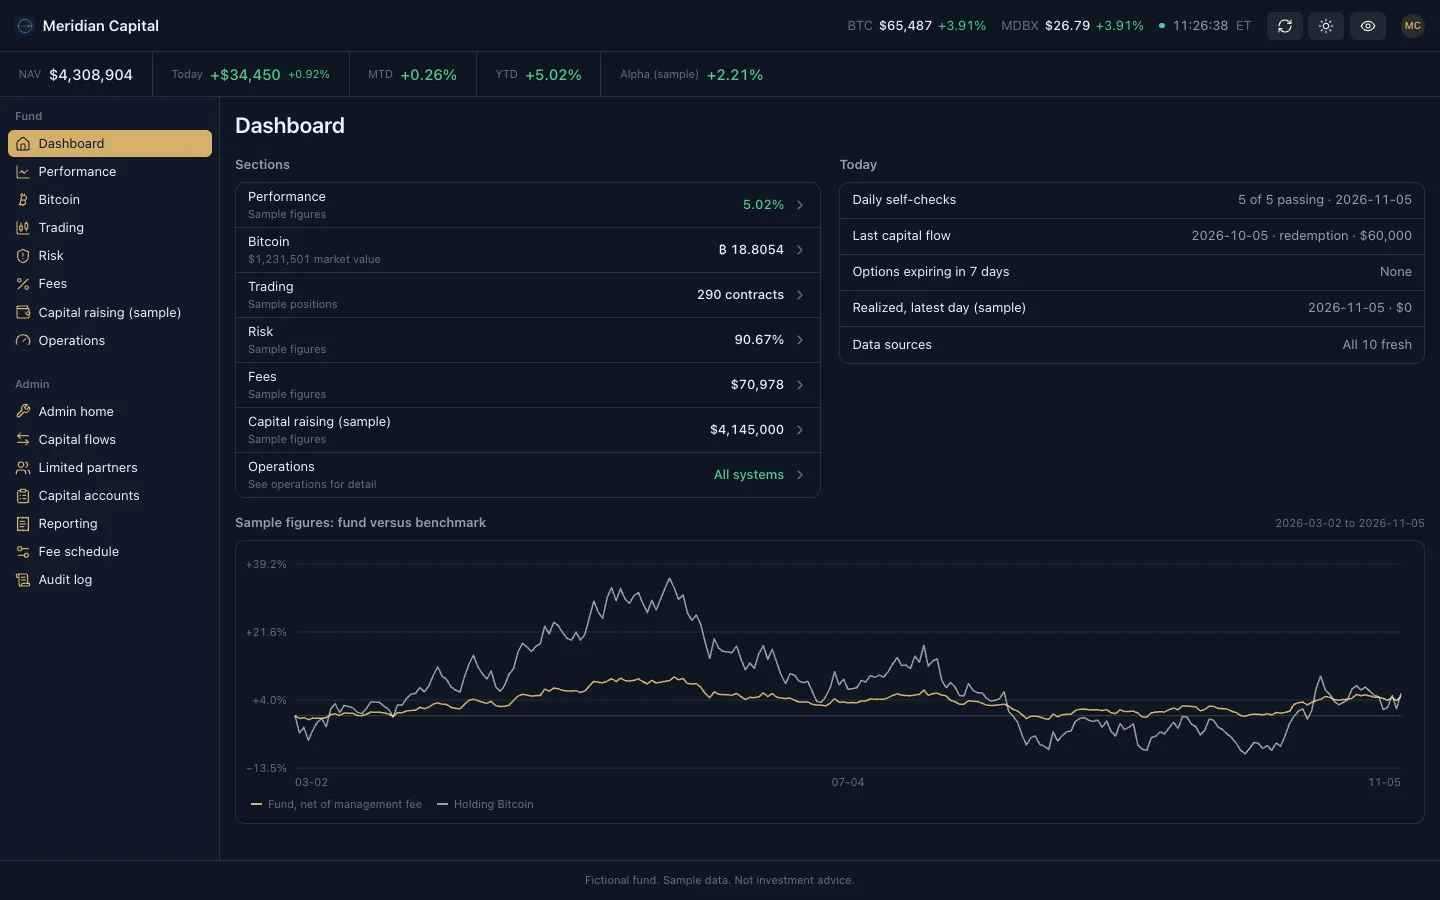
Summary. Fund value, the day, alpha, and a chart of the fund against holding Bitcoin.
  1. 01Summary. Fund value, the day, and a chart of the fund against a benchmark. Sample figures.
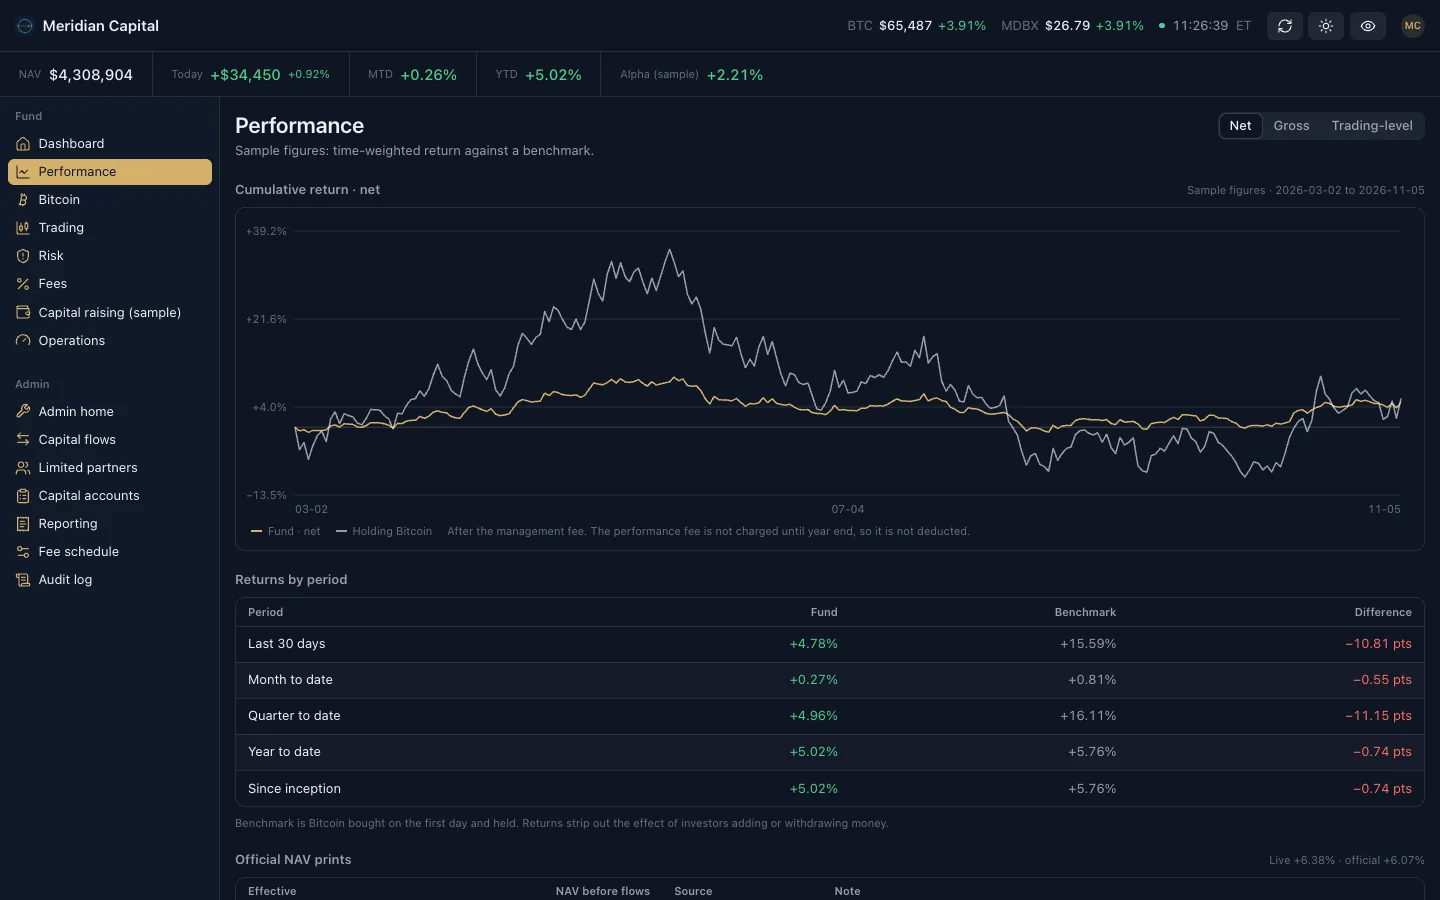
  2. 02Performance. Returns by period, net or gross, against a benchmark. Sample figures.
  3. 03Reconciliation. The administrator's figures beside the fund's own, field by field.
  4. 04Risk. Margin cushion and a what-if simulator for a fall in Bitcoin.
  5. 05Capital accounts. Each contribution valued at its entry date, with its unit price.
  6. 06A partner statement, in its paper view, ready to print.

Sample data

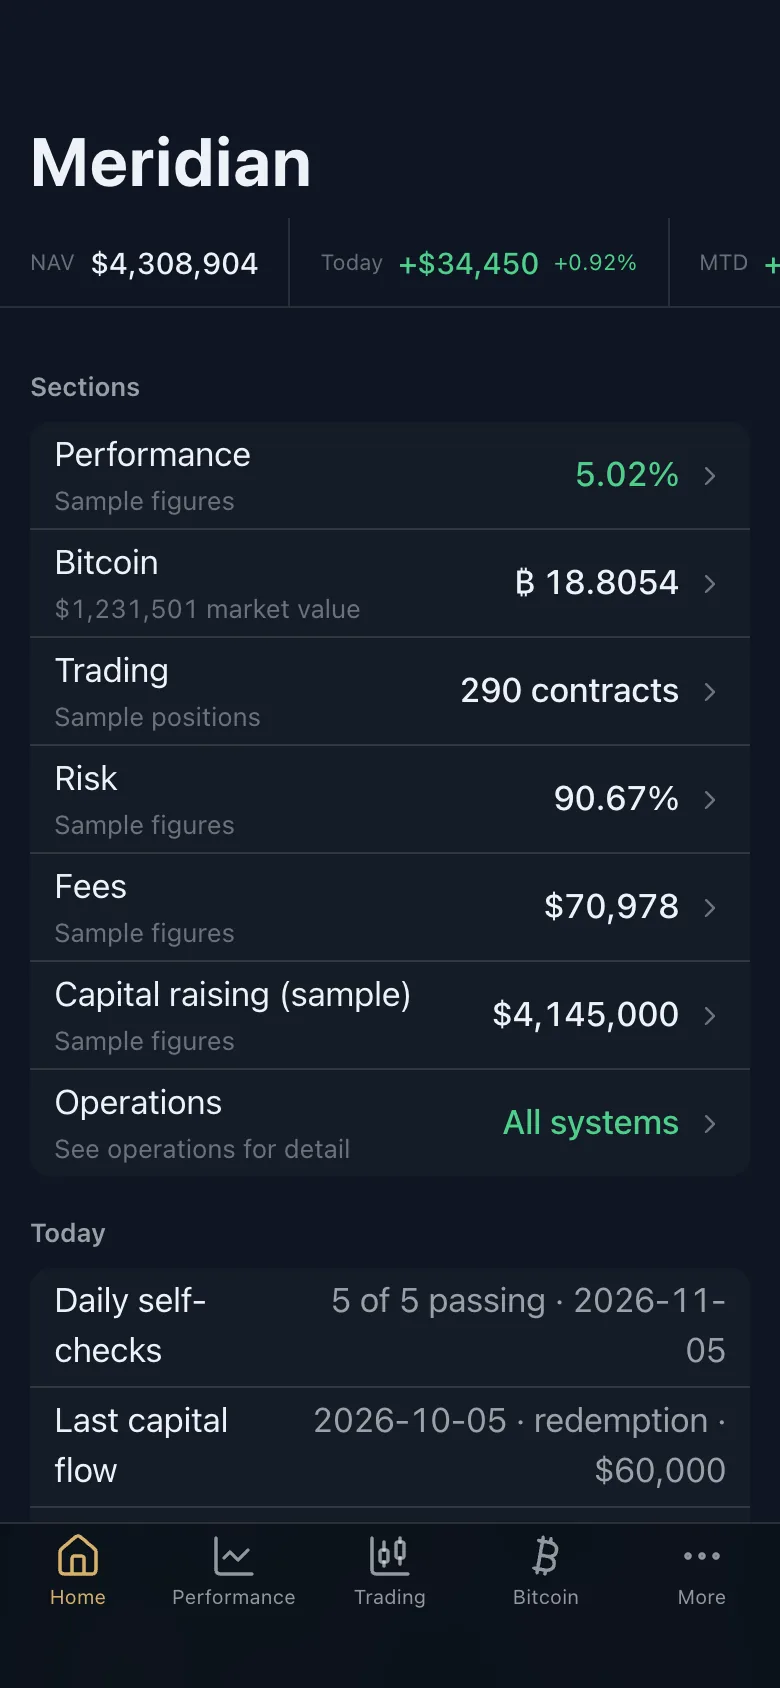
Summary. Fund value, the day, and each section in a row.
  1. 01Summary. Fund value, the day, and each section in a row. Sample figures.
  2. 02Performance. The fund against a benchmark, and returns by period.
  3. 03Reconciliation. The administrator's figures beside the fund's own.
  4. 04Risk. Margin cushion and a what-if simulator.
  5. 05Capital accounts. Each contribution at its entry date.
  6. 06A partner statement, in its paper view.

Sample data

What it does

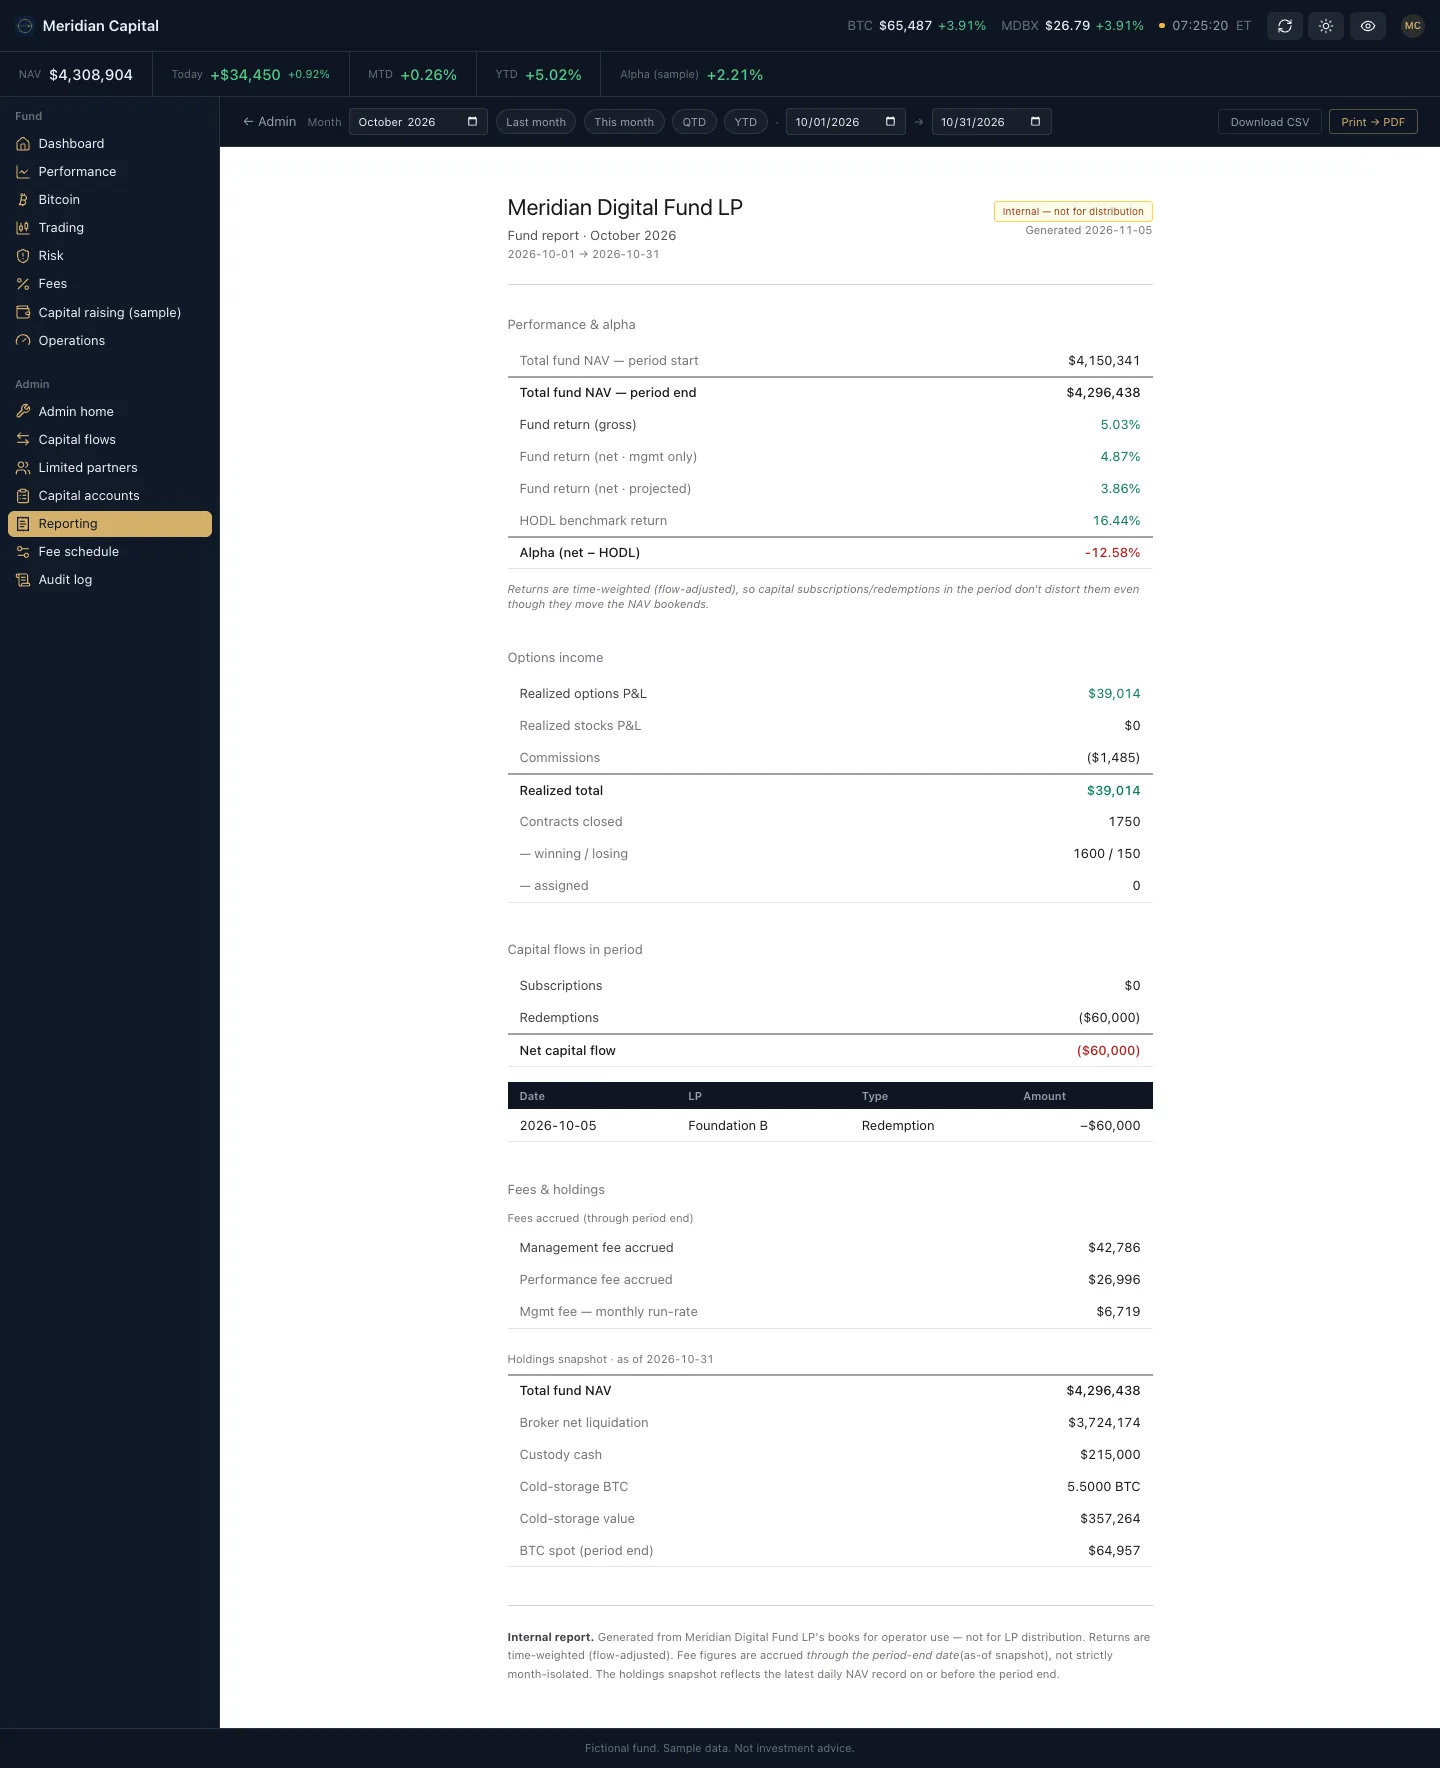
A small fund has partners who put money in, fees to work out, statements to send, and an outside administrator whose numbers have to match. Meridian keeps all of that in one set of books. Each partner has a capital account that shows what they put in, what it is worth now, and what they have been charged. Fees, statements, and reporting exports come from those same rows, so nothing is typed twice.

The dashboard shows the fund's value and returns, its bitcoin holdings by venue, its options book with an expiry calendar, and a risk page with a margin-call simulator. A co-pilot panel reads the book and suggests trades, and it is read-only, so it can look but never send an order.

The operations side is where trust gets built. Every day the system checks its own figures against the administrator's and keeps a note of every difference. A freshness panel shows how old each source of numbers is, so a stale number looks stale. An audit log records admin actions and member activity. There are nine features in all.

The public demo shows the same fund on every visit.
Walkthrough

  1. The fund on one page

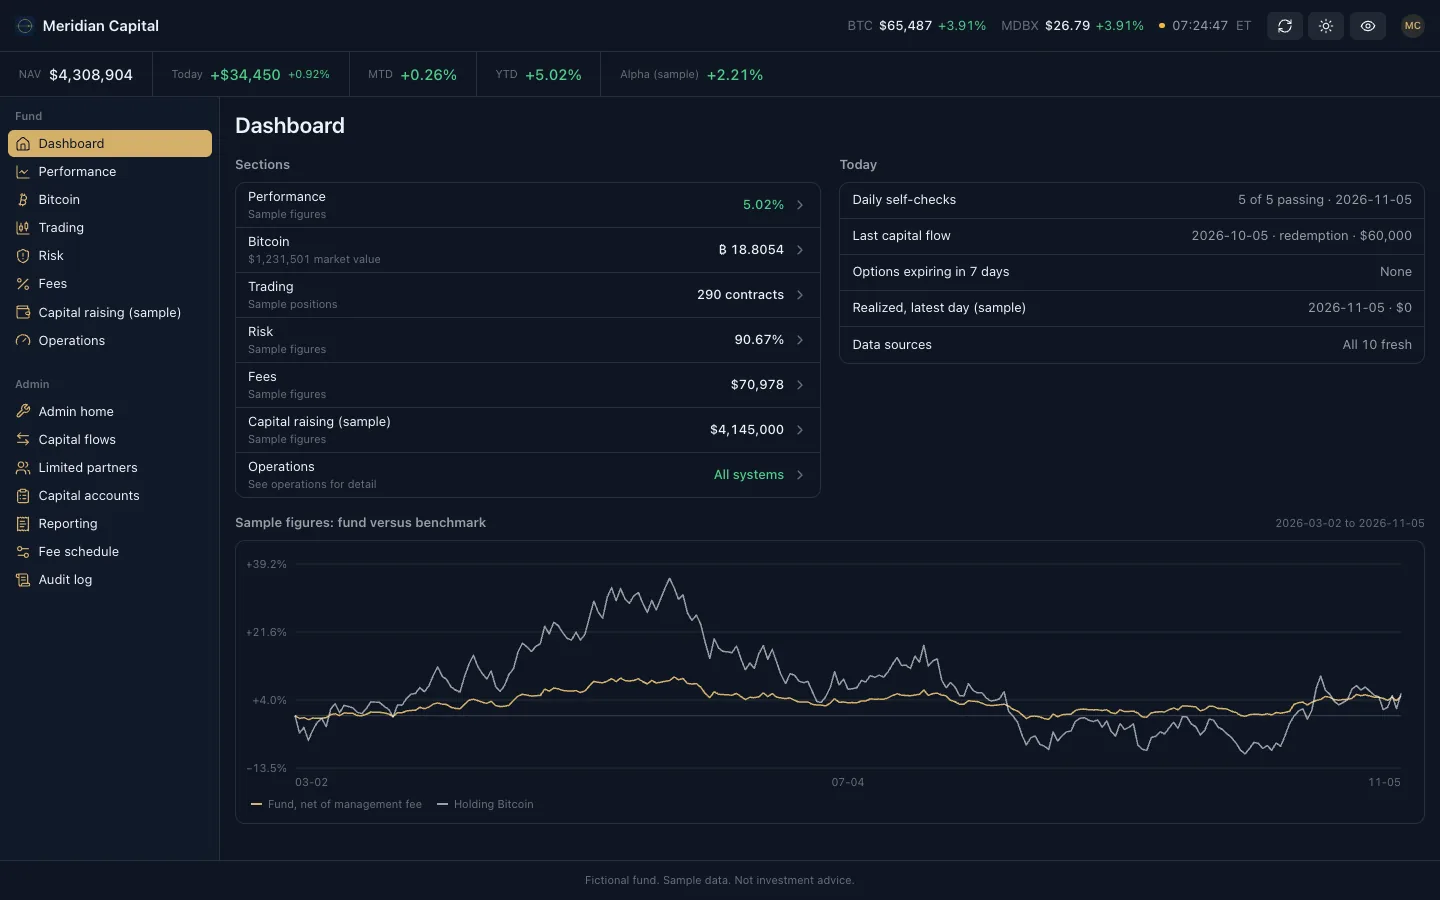
    The dashboard opens on the fund's value, the day, the month, and the year, with a short list of sections underneath. A partner who wants one number gets it before they scroll. A chart sets the fund against simply holding Bitcoin, so the question of whether the fund earned its fee sits on the first screen.

    Summary. Fund value, the day, alpha, and a chart of the fund against holding Bitcoin.
  2. Returns, net or gross

    The performance page shows returns by period, before and after fees, against a benchmark. A fund has to be honest about what its partners kept, not only what the book made. Putting both numbers side by side removes the argument.

    Performance. Returns by period, net or gross, against the benchmark.
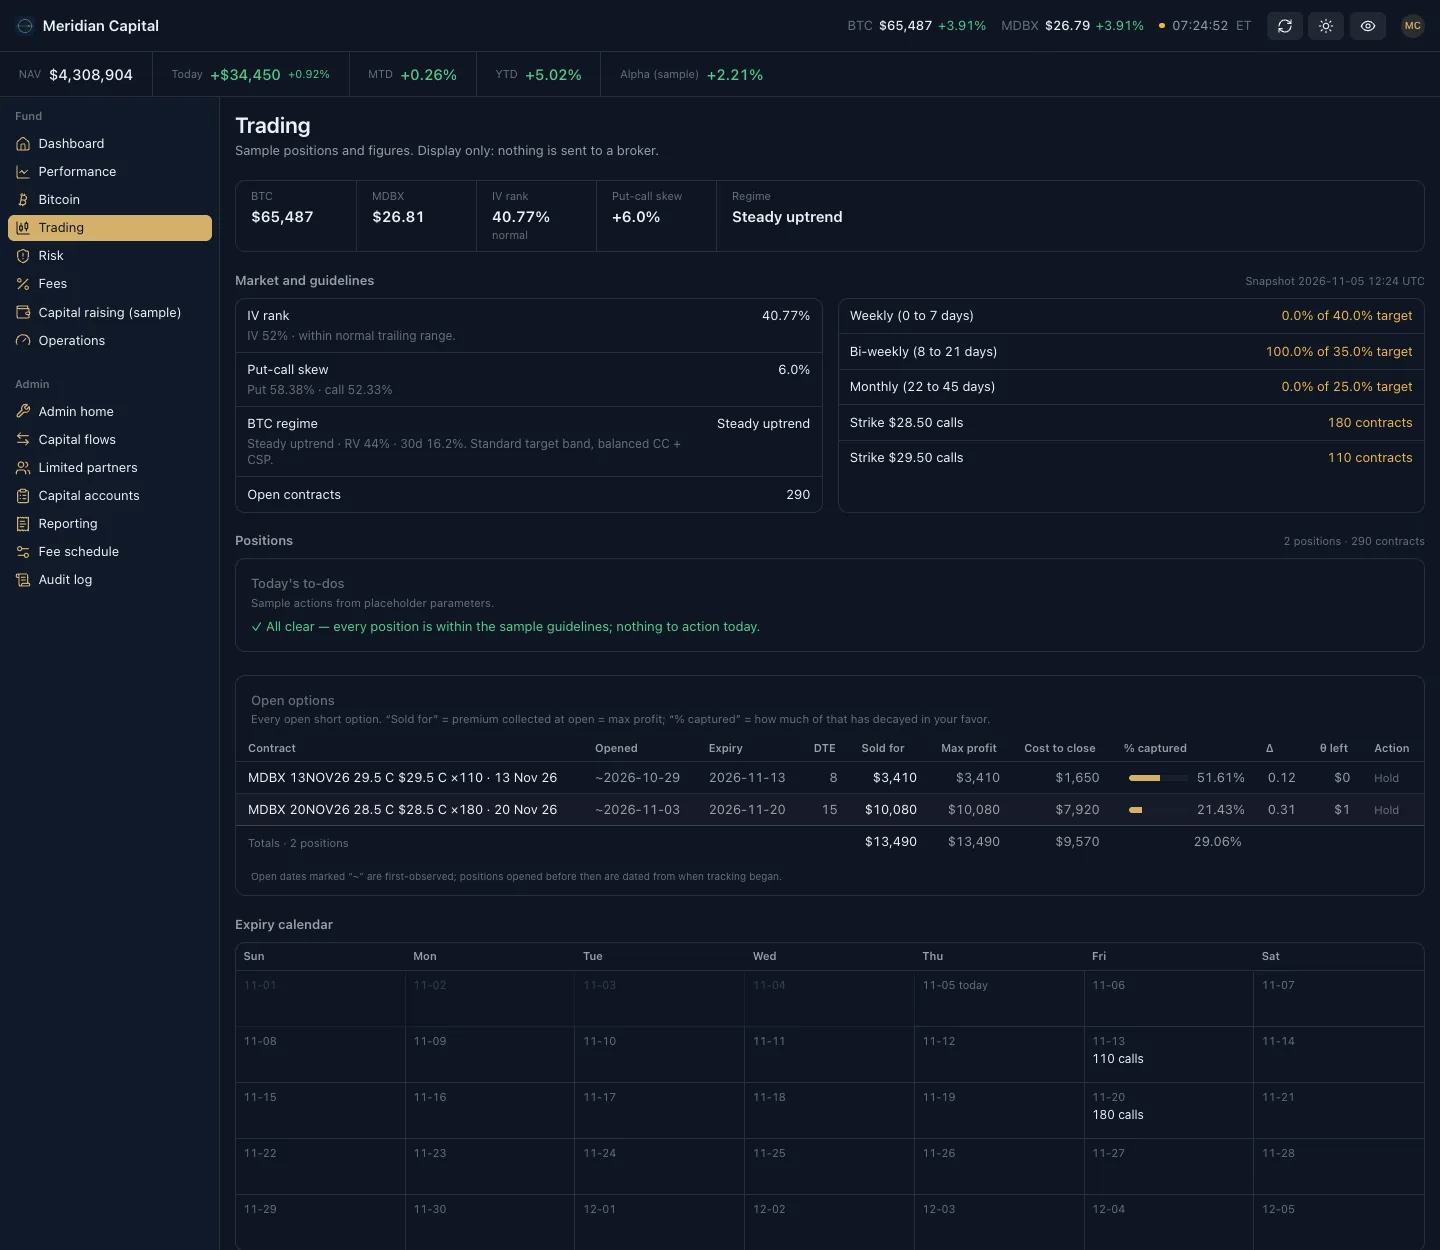
  3. The options book

    Each open option shows what the fund sold it for, how much of that premium has already decayed in the fund's favor, and when it expires. An expiry calendar below shows which days carry contracts. A manager sees what needs attention this week without opening a spreadsheet.

    Trading page with open options, an expiry calendar, and the book's figures.
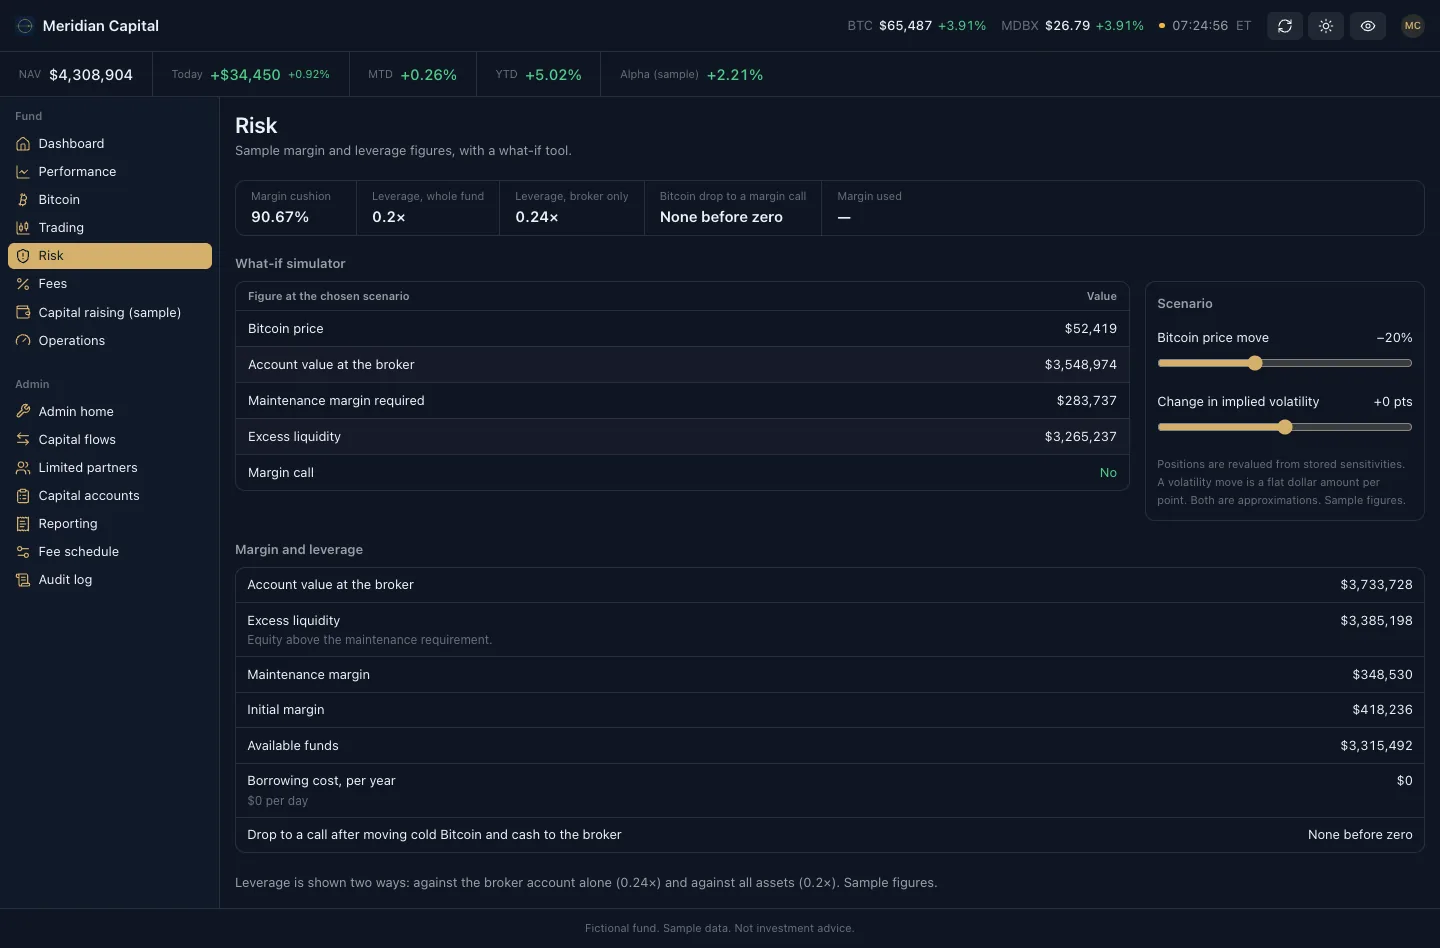
  4. How far can Bitcoin fall

    The risk page shows the margin cushion and the fund's borrowing in plain figures. A slider lets the team drop the Bitcoin price and watch the broker account, the margin requirement, and the margin call answer move. The fund finds out what a bad day does to it before the bad day arrives.

    Risk page with margin figures and a what-if simulator for a fall in the Bitcoin price.
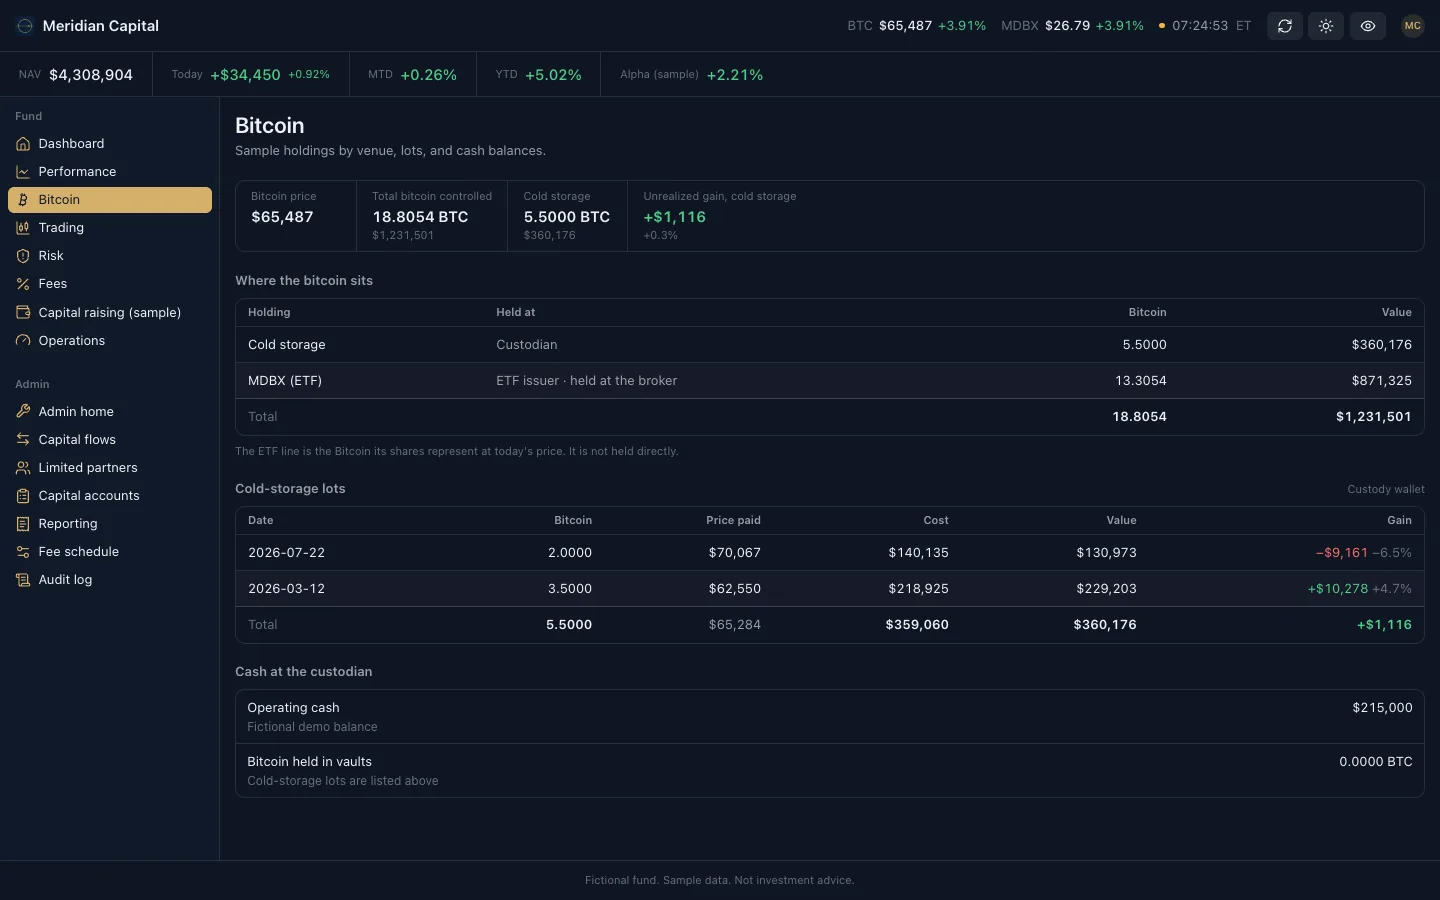
  5. Where the bitcoin sits

    The bitcoin page shows what the fund controls and where it is held: the coins in cold storage with a custodian, and the share held through an ETF at the broker. Each cold-storage lot keeps the date and the price paid, so the gain on every lot is its own line. Cash at the custodian sits underneath. A partner who asks where the money actually is gets the answer on one screen.

    Bitcoin page with holdings by venue and cold-storage lots with cost and gain.
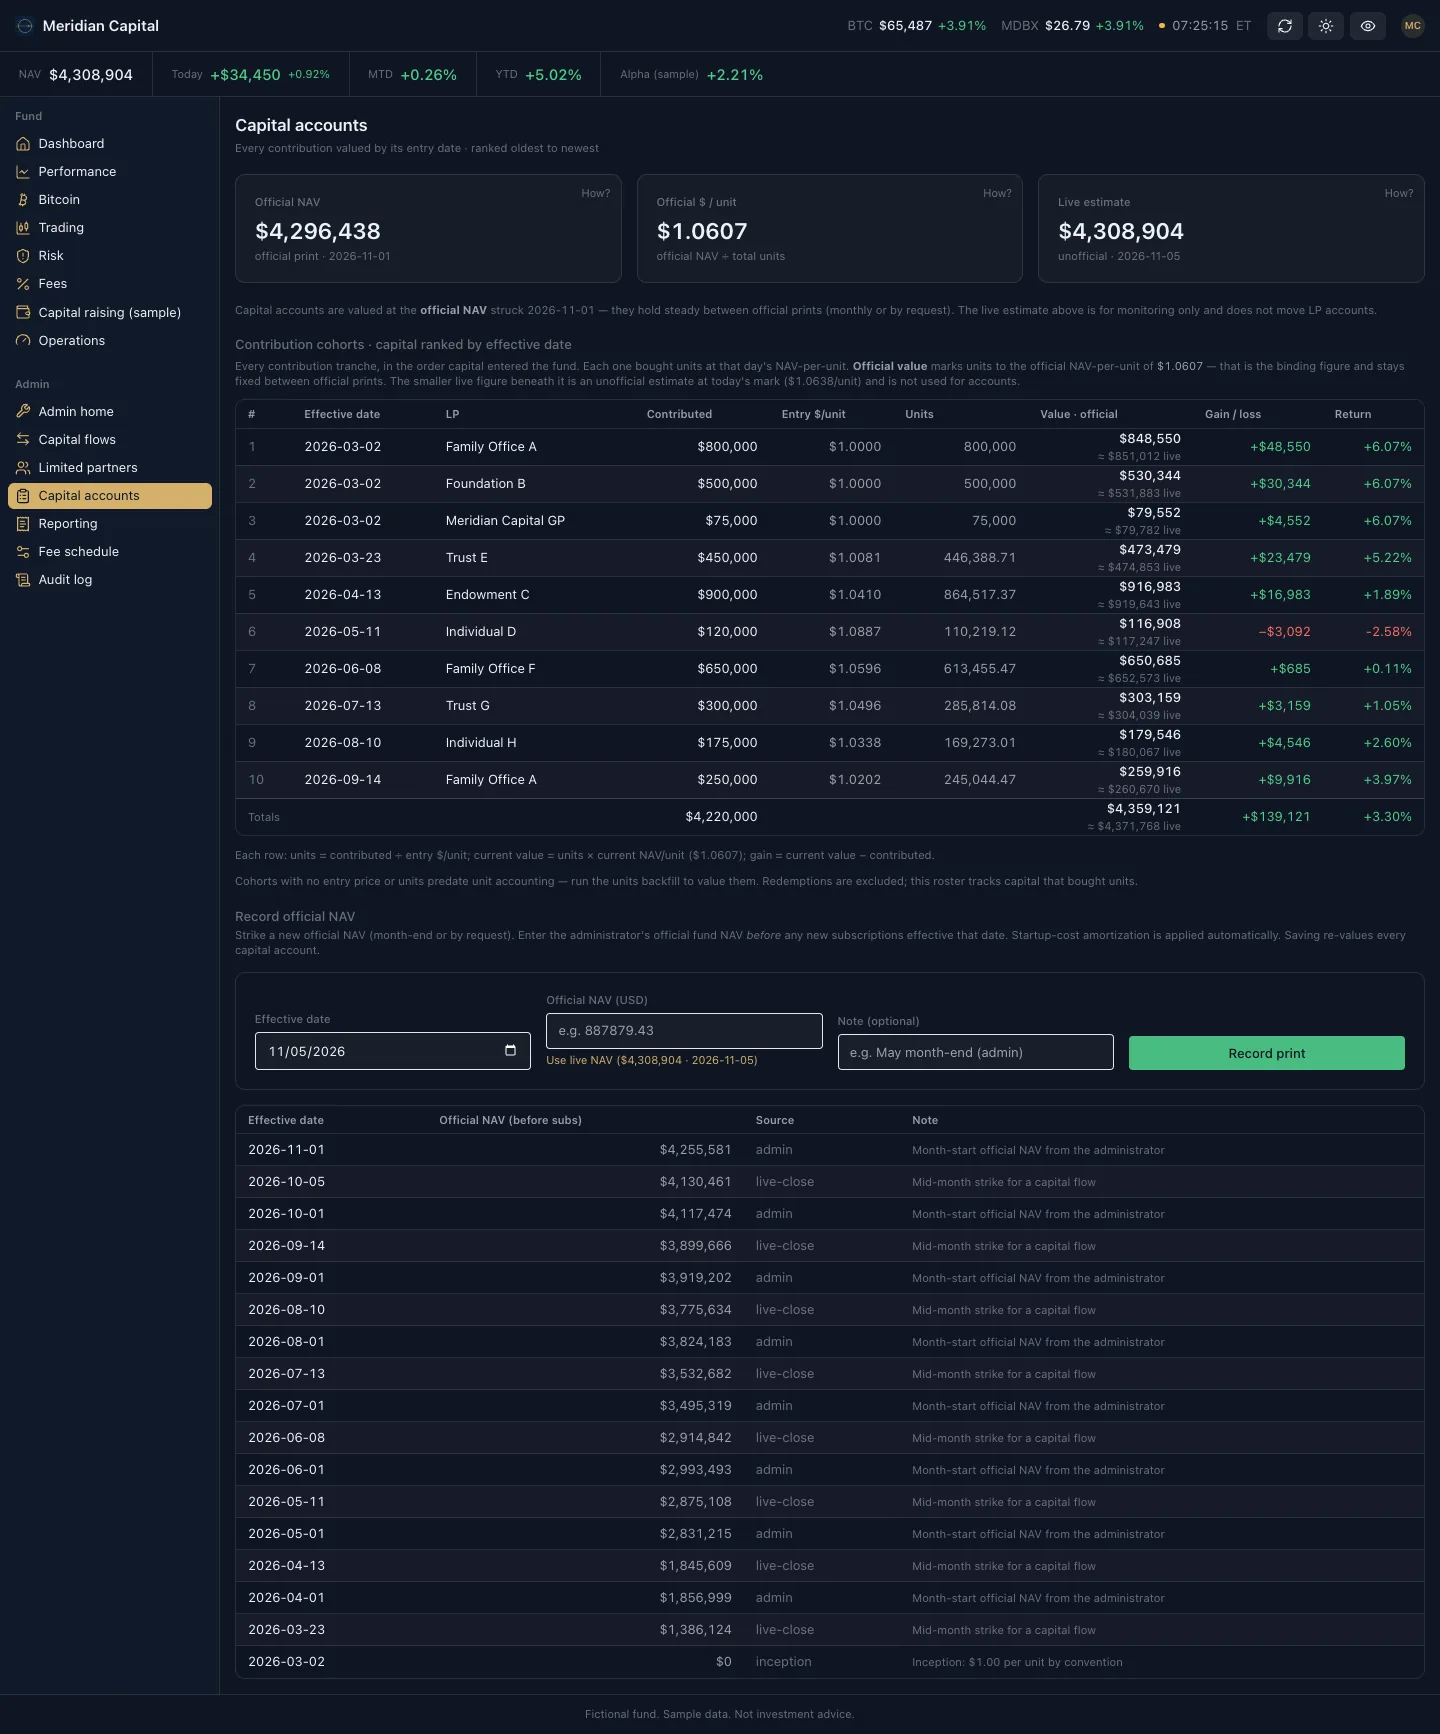
  6. Every contribution at its own price

    Capital accounts list each contribution with the date it came in, the unit price that day, and what it is worth now. New money buys units at the current price, so late arrivals do not share in gains made before they joined. The record of official NAV prints sits below the table.

    Capital accounts page listing each contribution with units, value, and gain, above the official NAV history.
  7. A statement a partner can print

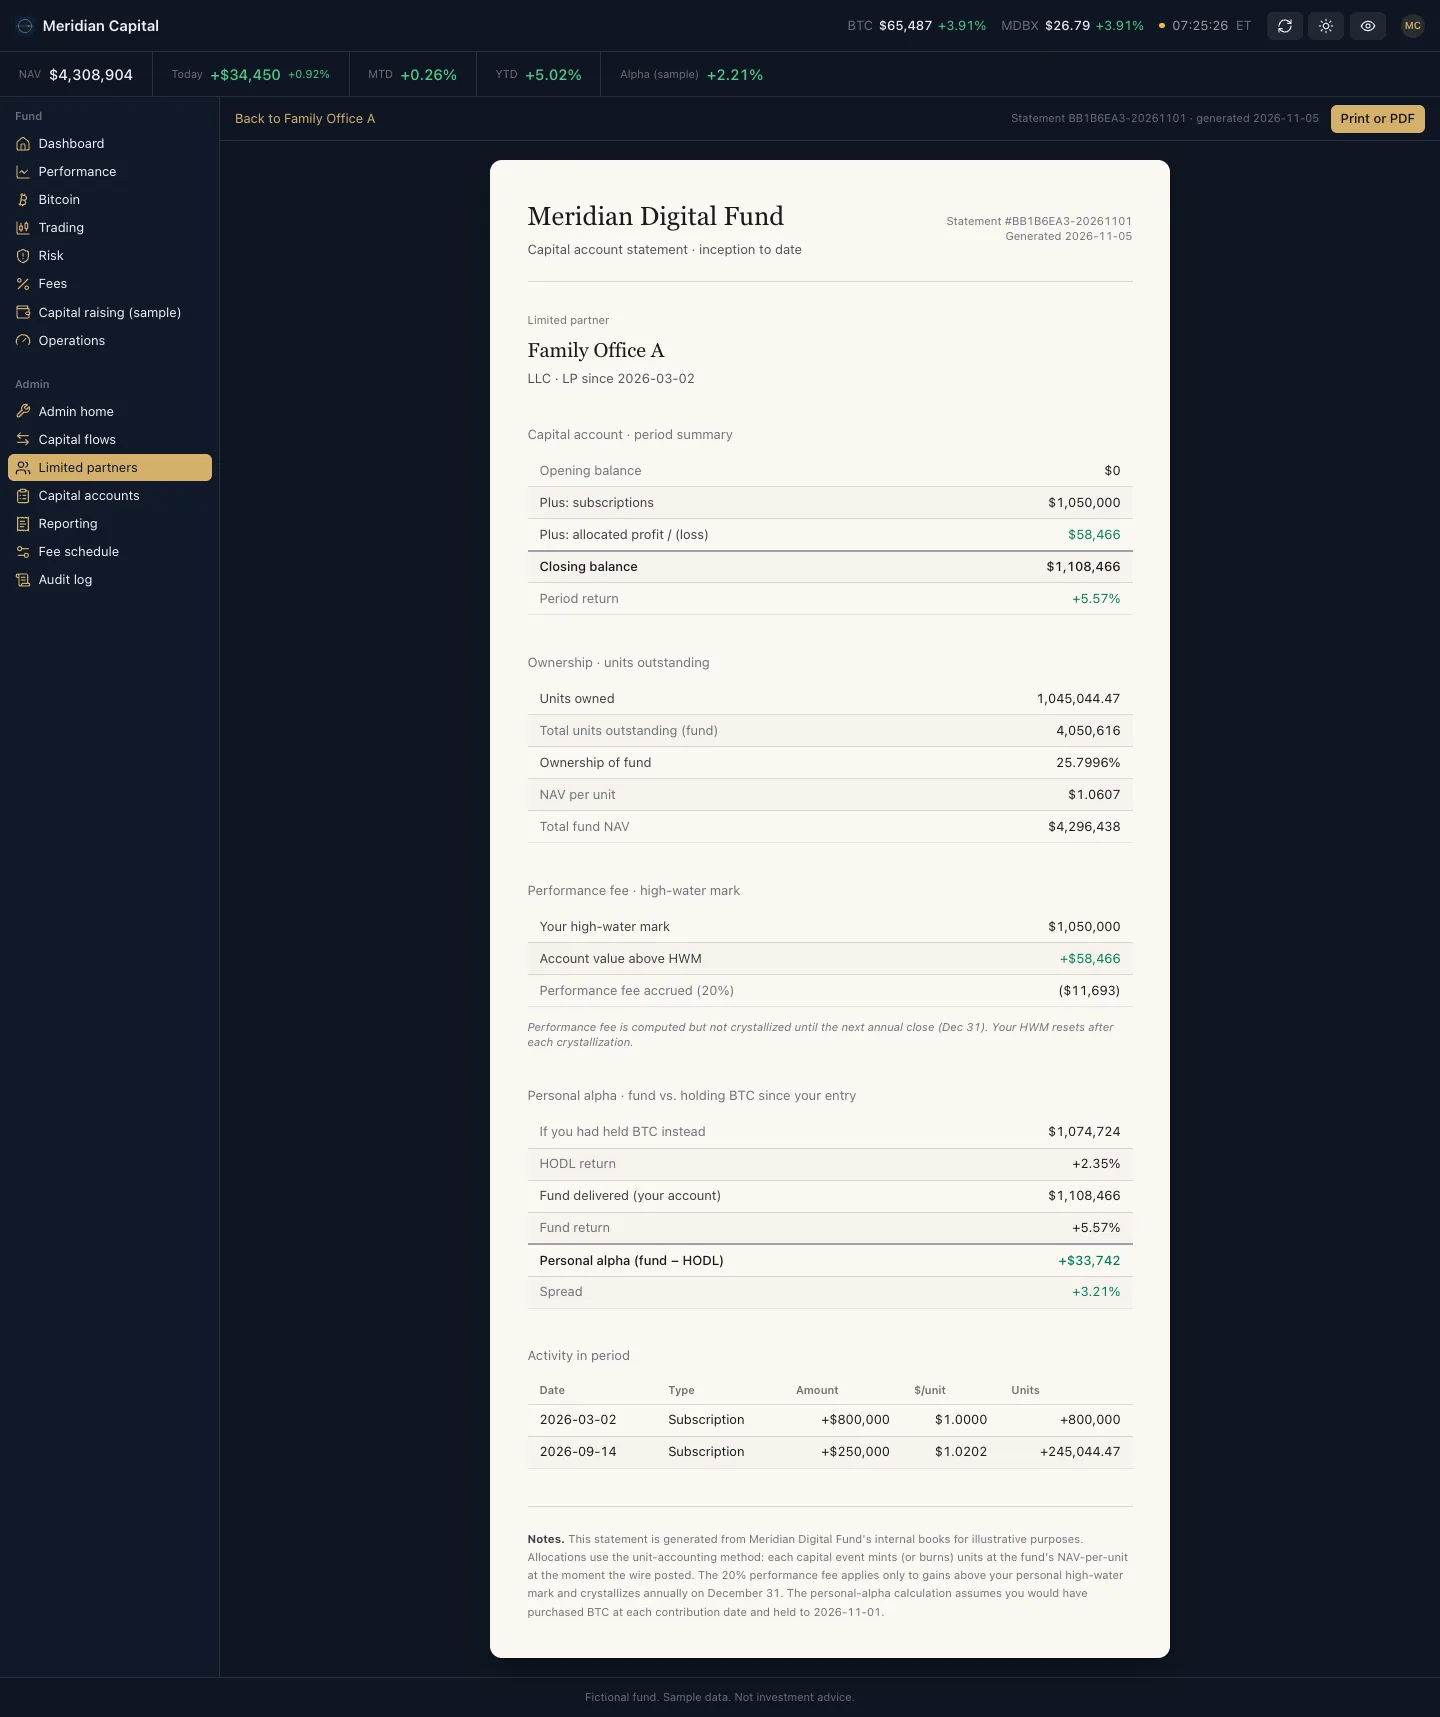
    The partner statement shows the opening balance, subscriptions, allocated profit, and closing balance. It also shows what the same money would have earned in Bitcoin since the partner joined. The statement comes from the books, so the figures a partner reads match the ones the manager sees.

    Partner statement in a paper view with capital account, units, performance fee, and a Bitcoin comparison.
  8. Checks against the administrator

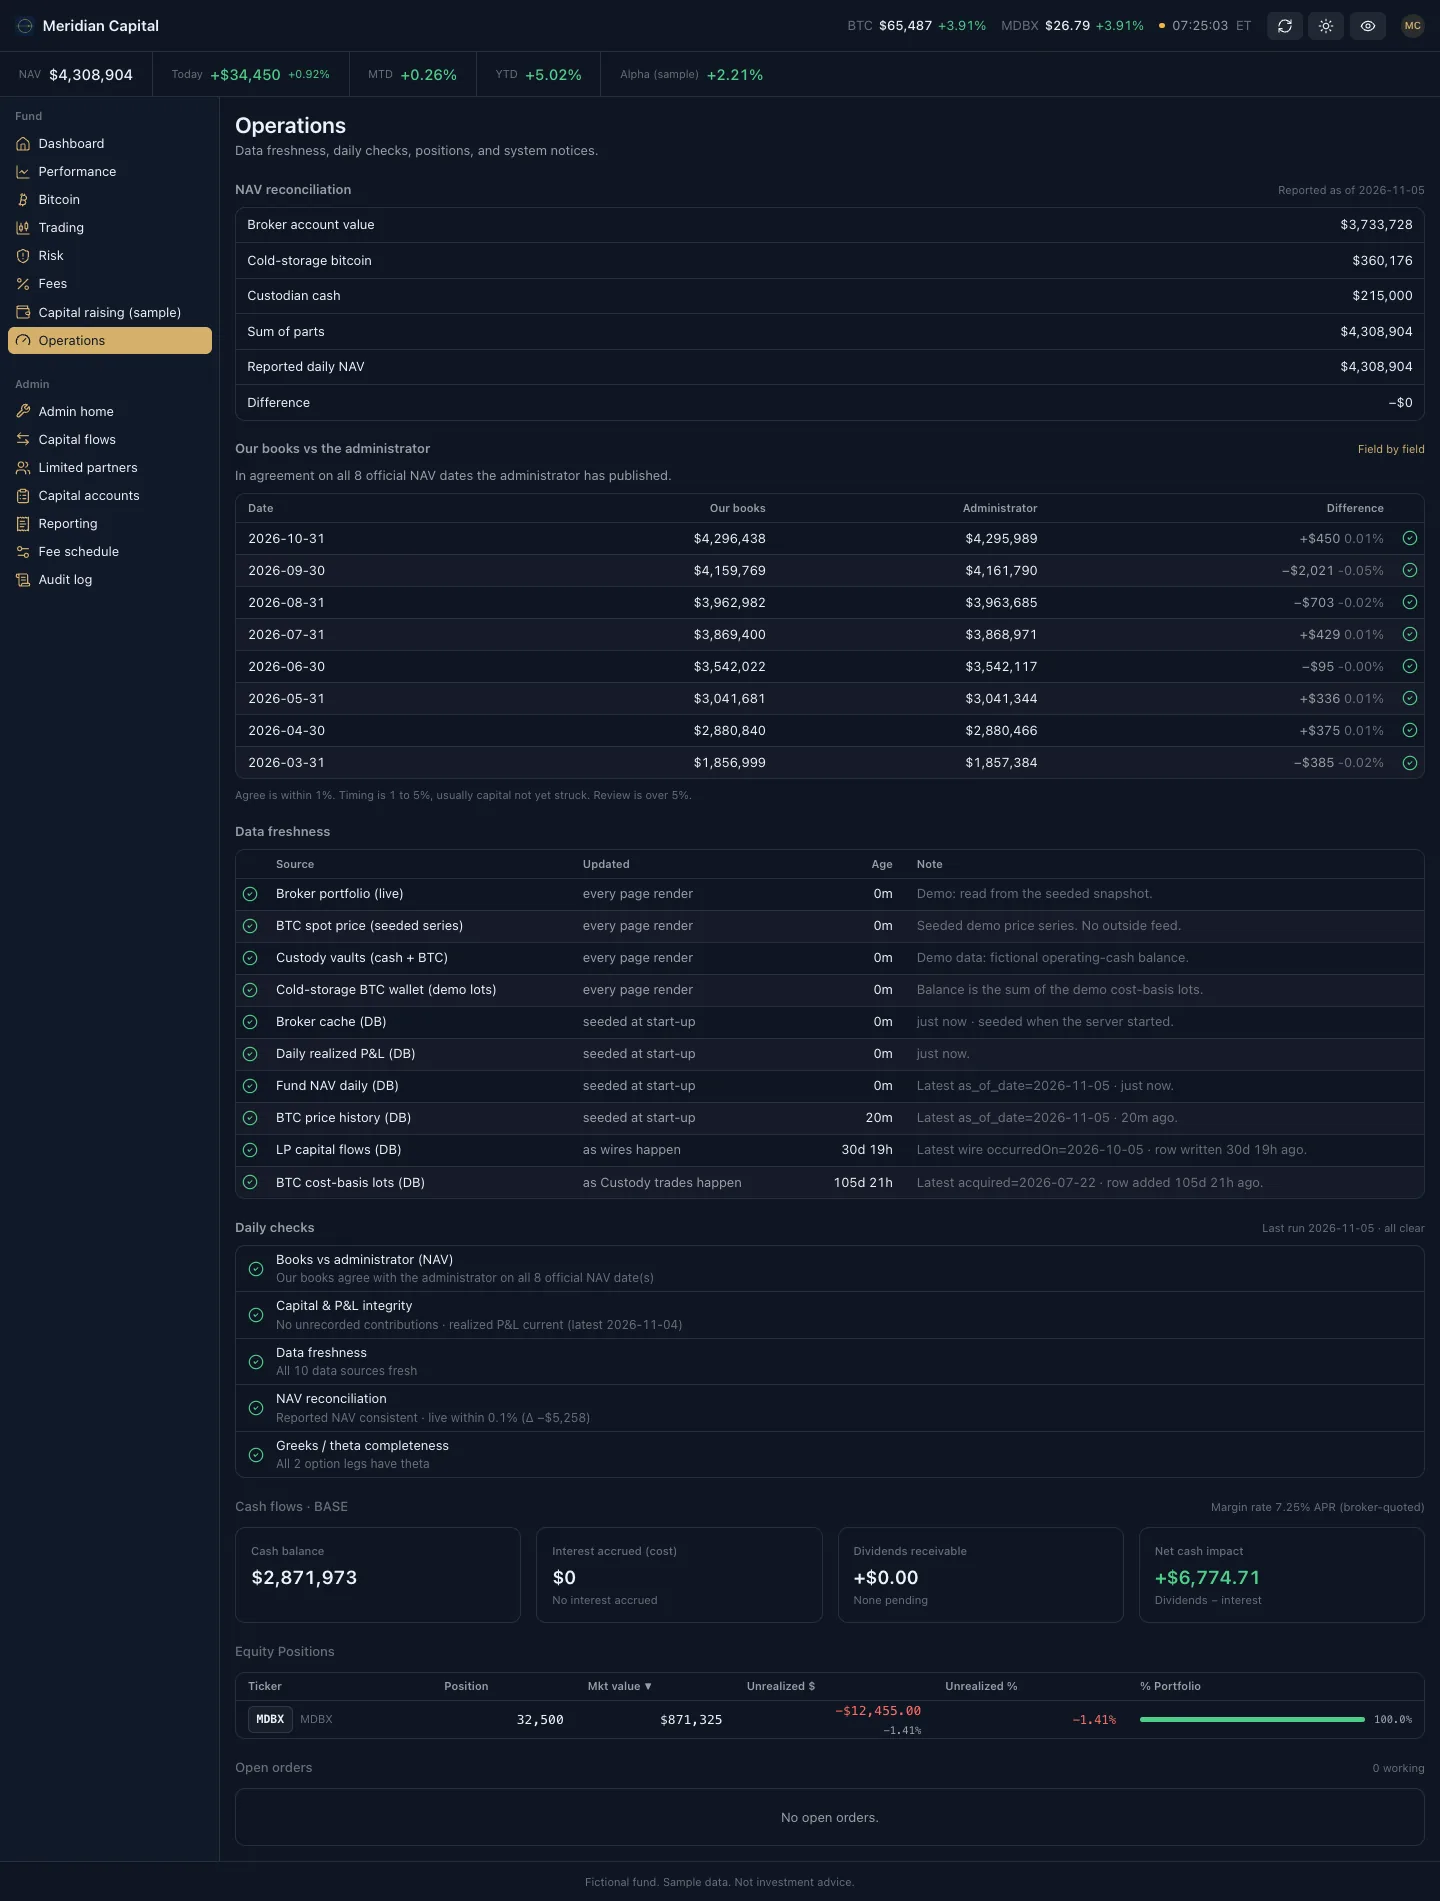
    The operations page lines up the fund's own daily value against the administrator's figure for every month end, and flags any gap past a set limit. It also lists each source of numbers with its age, plus five daily checks with a pass or a fail. A stale feed or a mismatch shows up on this page before a partner asks about it.

    Operations page with NAV reconciliation, a data freshness table, and five daily checks.

By the numbers

Hard problem we solved

Showing fresh numbers without hammering the broker

A fund dashboard reads from a broker, and a broker is slow, rate-limited, and sometimes down. Every page that asked it for positions on its own would be slow, and a failed call would leave a hole in the page. The numbers also have to be honest about their age.

We built a snapshot cache for the broker's data. A refresh pulls the book and its option sensitivities once and stores the result with a timestamp. Pages and the co-pilot read the cached book, so they stay fast whatever the broker is doing. Every figure carries its fetch time, and the operations page turns that into a freshness reading. The co-pilot also checks the age of the data before it suggests anything.

That makes the cache an honest one. If the numbers go stale, the dashboard says so and the co-pilot knows to be careful, where an ordinary cache would show old figures as if they were new.

DashboardNext.js pagesAPI routeshealth, prices, adminServicesnav, LP, fees, opsScheduled jobsdaily and hourlyDatabasePostgres, DrizzleDemo generatorpure, fictional fundOutside feedsbroker, administrator

Where it stands

The demo runs on sample data. The software behind it is in production at a real operating hedge fund.

Talk to us about your fund

Tell us what your partners and your back office need. hello@builtonthebeach.com

Gallery

Sample data. Fictional names and figures.

Landfall

A hurricane app that counts down to the hour storm winds reach your house, and tells you what to do before then.

Next in Apps